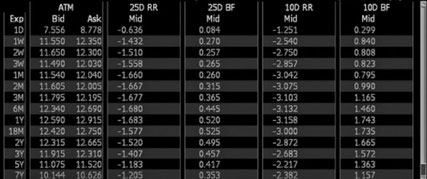
In the foreign exchange (FX) markets, understanding market sentiment and price expectations is critical for traders and investors. Market participants rely on various tools and indicators to gauge potential price movements and volatility. Among these, Risk Reversal (RR) and Butterfly (BF) Volatility are key measures derived from options pricing that provide valuable insights into how traders perceive the market's direction and potential volatility.
These measures are calculated using the implied volatilities of options at different strike prices, focusing particularly on out-of-the-money (OTM) options and at-the-money (ATM) options. They
are especially useful in FX markets, where currency pairs often exhibit unique volatility structures influenced by geopolitical events, economic data releases, and central bank policies.
Risk Reversal (RR)
Risk Reversal (RR) is a measure used in FX markets to assess market sentiment. It quantifies the difference in implied volatility between out-of-the-money (OTM) call options and OTM put options with the same expiration date. The formula for calculating the 25-delta Risk Reversal is:
\( \text{RR}_{25} = \sigma_{\text{Call}, 25\Delta} - \sigma_{\text{Put}, 25\Delta} \)
Where:
- \( \sigma_{\text{Call}, 25\Delta} \): Implied volatility of the 25-delta call option.
- \( \sigma_{\text{Put}, 25\Delta} \): Implied volatility of the 25-delta put option.
The 25-delta options are near the at-the-money (ATM) level, with approximately a 25% probability of expiring in-the-money or out-of-the-money. These options are preferred for their liquidity and their ability to reflect market sentiment without extreme skewness from deep ITM or OTM options.
A positive RR indicates higher implied volatility for call options, suggesting bullish sentiment on the currency pair. A negative RR reflects higher implied volatility for put options, indicating bearish sentiment.
Example
Suppose the implied volatility of the 25-delta call option is 8.5%, and the implied volatility of the 25-delta put option is 7.2%. The Risk Reversal is calculated as:
\( \text{RR}_{25} = 8.5\% - 7.2\% = 1.3\% \)
This positive RR suggests that the market expects potential upside movements in the currency pair, indicating bullish sentiment.
Butterfly (BF) Volatility
Butterfly volatility represents the combined implied volatility of at-the-money (ATM) options and 25-delta options (calls and puts). It provides insights into the market's expectation of price stability or potential volatility. The formula for the 25-delta Butterfly is:
\( \text{BF}_{25} = \frac{\sigma_{\text{Call}, 25\Delta} + \sigma_{\text{Put}, 25\Delta}}{2} - \sigma_{\text{ATM}} \)
Where:
- \( \sigma_{\text{Call}, 25\Delta} \): Implied volatility of the 25-delta call option.
- \( \sigma_{\text{Put}, 25\Delta} \): Implied volatility of the 25-delta put option.
- \( \sigma_{\text{ATM}} \): Implied volatility of the at-the-money option.
Butterfly volatility is useful for identifying periods of uncertainty or events that might lead to significant price movements.
Example:
Assume the following implied volatilities:
- \( \sigma_{\text{Call}, 25\Delta} = 8.5\% \)
- \( \sigma_{\text{Put}, 25\Delta} = 7.2\% \)
- \( \sigma_{\text{ATM}} = 7.8\% \)
The Butterfly Volatility is calculated as:
\( \text{BF}_{25} = \frac{8.5\% + 7.2\%}{2} - 7.8\% = 7.85\% - 7.8\% = 0.05\% \)
A low Butterfly Volatility suggests that the market expects price stability or limited significant price movements in the near term.
Interconnections with Implied Volatility Skew
Risk Reversal, Butterfly Volatility, and the implied volatility skew are interconnected. The implied volatility skew reflects differences in implied volatility across strike prices, deviating from the ATM level.
A steep skew with a large RR indicates strong market sentiment (bullish or bearish). High BF values often coincide with heightened uncertainty or major upcoming events.
These metrics collectively provide traders with valuable insights into market expectations, sentiment, and potential price movements in FX markets.


Écrire commentaire