
The Riemann integral is based on partitioning the domain (x-axis) of a function into small sub-intervals and approximating the area under the curve by summing the areas of rectangles.
The process of Riemann integration begins by dividing the interval [a, b], over which the integral is to be calculated, into n smaller sub-intervals. For each sub-interval, a point is chosen within it, denoted as xi*, and the height of the corresponding rectangle is calculated as f(xi*). The width of the rectangle is the length of the sub-interval, which is given by:
$$\Delta x = \frac{b - a}{n}$$
The area of each rectangle is then:
$$f(x_i^*) \Delta x$$
Summing these areas over all sub-intervals produces a Riemann sum. The final step involves taking the limit as the number of sub-intervals, n, approaches infinity, and the width of each interval, \(\Delta x\), approaches 0. This limit gives the Riemann integral:
$$\int_a^b f(x) \, dx = \lim_{n \to \infty} \sum_{i=1}^n f(x_i^*) \Delta x$$
However, the Riemann integral has limitations. It is well-suited for functions that are continuous or have a limited number of discontinuities. If a function exhibits highly irregular behavior or has discontinuities at many points, the Riemann sum may fail to converge, making it impossible to integrate the function using this method. This difficulty arises because the Riemann approach focuses on partitioning the domain (x-axis). When the function's behavior is highly erratic within an interval, the approximation by rectangles does not accurately capture the area under the curve.
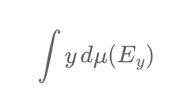
In contrast, the Lebesgue integral takes a different approach by partitioning the range (y-axis) of the function. Instead of focusing on intervals of the domain, the Lebesgue method focuses on the values the function takes and considers the "size" of the set of inputs (x-values) corresponding to each value in the range. The process of Lebesgue integration begins by dividing the range of the function, which consists of the y-values that f(x) assumes, into smaller intervals. The next step involves finding the set of all x-values that correspond to each y-value or y-interval. This set is known as the pre-image of the y-value. The integral is then calculated by summing the products of each y-value and the "measure" (or size) of its corresponding set of x-values:
$$\int y \, d\mu(E_y)$$
where \(\mu(E_y)\) is the measure of the set of x-values that map to the y-value.
The Lebesgue integral offers several advantages over the Riemann integral. It is more flexible and can handle functions with many discontinuities. By focusing on the function's values rather than its behavior over intervals, the Lebesgue integral is able to integrate "jumpy" or irregular functions that would be problematic for the Riemann approach. This makes the Lebesgue integral particularly powerful for dealing with complex functions often encountered in finance.
To compare these two integrals, consider the indicator function \(I_S(x)\), which is defined as taking the value 1 if \(x\) is in a specified set \(S\), and 0 otherwise. If \(S\) is the set of rational numbers within [0, 1], then \(I_S(x)\) is 1 for rational \(x\) and 0 for irrational \(x\). This poses a challenge for the Riemann integral because rational and irrational numbers are densely packed in any interval [a, b]. Each sub-interval contains both rational and irrational numbers, so the function does not have consistent behavior within any sub-interval. As a result, the approximation by rectangles is ineffective, and the Riemann integral fails.
However, the Lebesgue integral can handle this situation effectively by considering only the values 0 and 1. It calculates the measure of the set of rational numbers, which is 0 in the interval [0, 1], and the measure of the set of irrational numbers, which is 1 in the interval [0, 1]. Therefore, the Lebesgue integral of \(I_S(x)\) over [0, 1] becomes:
$$\int_0^1 I_S(x) \, dx = 0 \times (\text{measure of rationals}) + 1 \times (\text{measure of irrationals}) = 0$$
In finance, asset prices often display "jumpy" behavior rather than smooth curves. Stock prices, options, and other financial instruments can experience sudden movements due to market news or economic events, making their behavior resemble complex functions rather than continuous ones. The Riemann integral aligns with traditional financial models like Black-Scholes, which assume that prices move continuously and smoothly. However, real-world data frequently shows sharp changes and discontinuities in prices, requiring a more flexible approach to integration. The Lebesgue-style integration is well-suited for such situations.
A key example of this is the Jump Diffusion Model in finance, which incorporates both continuous movements and sudden jumps in asset prices. The model can be expressed as:
$$dS_t = \mu S_t \, dt + \sigma S_t \, dW_t + J_t$$
where \(S_t\) is the asset price at time \(t\), \(\mu\) is the expected return (drift), \(\sigma\) is volatility, \(W_t\) is standard Brownian motion representing smooth random movements, and \(J_t\) is a term accounting for sudden jumps. The Lebesgue integral effectively integrates these more complex processes, allowing for the modeling of both continuous and discontinuous movements in prices.
In risk management, this flexibility has significant implications. Accurately pricing derivatives and other financial instruments requires understanding extreme movements or "tail events" such as market crashes. By using techniques inspired by the Lebesgue approach, financial models can better capture these risk factors and reflect a broader spectrum of market behaviors.
In summary, the main difference between these two integrals lies in their approach. The Riemann integral partitions the domain (x-axis), making it suitable for smooth, well-behaved functions but less so for irregular ones. The Lebesgue integral, on the other hand, partitions the range (y-axis), allowing for the flexible integration of functions with sudden jumps and complex behaviors, making it a powerful tool for modern finance and risk management.
Écrire commentaire