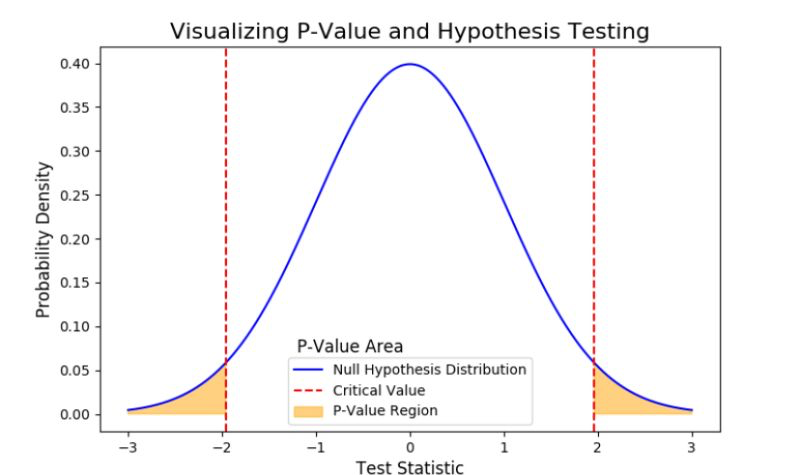
The p-value, short for "probability value," is a statistical measure that helps assess the strength of evidence against a null hypothesis in a hypothesis test. The null hypothesis represents the
absence of an effect or relationship in the data. It quantifies the likelihood of observing a result as extreme as the one obtained, assuming that the null hypothesis is true.
In simpler terms, the p-value tells you how probable it is to get the observed data if there is actually no effect or relationship (as suggested by the null hypothesis). A lower p-value indicates
that the observed data is less likely to occur under the assumption of the null hypothesis, which may suggest that the null hypothesis is not true and that there might be a real effect or
relationship in the data.
Here's how to interpret p-values:
1. Small p-value (typically ≤ 0.05):
- If the p-value is very small (commonly less than 0.05 or 5%), it suggests that the observed data is unlikely to have occurred if the null hypothesis is true.
- This may lead to rejecting the null hypothesis in favor of the alternative hypothesis, which proposes the presence of an effect or relationship.
- If the p-value is relatively large (greater than 0.05), it suggests that the observed data is quite likely to have occurred even if the null hypothesis is true.
- This may lead to failing to reject the null hypothesis, indicating that there isn't strong evidence to support an effect or relationship.
Remember that the p-value alone does not tell you the size or practical significance of an effect. It only indicates the strength of evidence against the null hypothesis. To draw meaningful conclusions, you should also consider the context of the study, the practical implications, and the significance level you choose for making decisions (often denoted as α, with 0.05 being a common value).
In summary, the p-value is a crucial statistical tool that helps you decide whether the observed data provides strong enough evidence to question or reject the null hypothesis and supports the alternative hypothesis, which proposes the presence of an effect or relationship.
Key Takeaways:
1. p-value purpose: Assesses evidence against the null hypothesis (no effect or relationship).
2. Interpretation:
- Small p-value (≤ 0.05): Suggests rejecting the null hypothesis, indicating a possible effect.
- Large p-value (> 0.05): Suggests weak evidence, often leading to not rejecting the null hypothesis.
3. Limitations: p-value alone doesn’t indicate effect size or practical significance; context and chosen significance level (α)
matter.


Écrire commentaire