In finance, decisions often rely on forecasts derived from statistical data. However, these forecasts carry an inherent level of uncertainty that must be quantified to make informed decisions. Confidence intervals are central to this context, providing a range where an estimated parameter, such as a mean return, is likely to fall with a given probability.
Definition
A confidence interval is a range around a point estimate that indicates where the true parameter of the population (e.g., the mean) is highly likely to be. For instance, a 95% confidence interval means that if sampling were repeated multiple times, 95% of the calculated intervals would contain the true parameter.
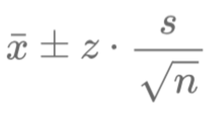
The confidence interval is calculated using the following formula:
\[ \text{Confidence Interval} = \bar{x} \pm z \cdot \text{SE} \]
where:
- \( z \) is the critical value associated with the confidence level (e.g., 1.96 for 95%),
- \( \text{SE} \) (Standard Error) is calculated as:
\[ \text{SE} = \frac{s}{\sqrt{n}} \]
with \( s \) being the standard deviation of the data and \( n \) the sample size.
The Role of the Confidence Interval
Confidence intervals are essential in finance for several reasons:
- Measuring uncertainty: They help estimate the degree of uncertainty around a financial parameter such as an average return, interest rate, or volatility.
- Decision-making: By providing a probable range, they assist risk managers or investors in making decisions considering optimistic and pessimistic scenarios.
- Comparing performance: Confidence intervals are used to determine if differences between two financial assets (e.g., two portfolios) are statistically significant.
Why is the Standard Error Important?
The standard error measures the variability of sample means around the true population mean. It depends on:
- The standard deviation (\( s \)): Higher data dispersion leads to a larger standard error.
- The sample size (\( n \)): A larger sample size reduces the standard error (as uncertainty decreases with more data).
Advantages and Disadvantages of a Wide Interval
A confidence interval can be wide or narrow depending on the data variability, sample size, and chosen confidence level. Here are the implications of a wide interval:
Advantages:
- Increased reliability: A wide interval reflects a higher probability of including the true parameter, which is critical for cautious analyses like stress tests or crisis scenarios.
- Uncertainty management: It fully acknowledges the uncertainties linked to volatility and data dispersion.
Disadvantages:
- Reduced precision: A wide interval indicates high data dispersion (\( s \)) or a small sample (\( n \)), meaning the estimated parameter can significantly deviate from the true mean.
- Decision-making difficulty: In finance, a very wide interval, such as a forecasted return between -10% and +20%, is hard to interpret and use for strategy.
Illustration with a Financial Example
Suppose you are analyzing a stock portfolio with a mean return (\( \bar{x} \)) of 5%, a standard deviation (\( s \)) of 15%, and a sample size (\( n \)) of 30 observations. The standard error is:
\[ \text{SE} = \frac{15}{\sqrt{30}} \approx 2.74 \]
For a 95% confidence interval (\( z = 1.96 \)):
\[ \text{Confidence Interval} = 5 \pm 1.96 \cdot 2.74 \approx [-0.37\%, 10.37\%] \]
This interval indicates a 95% probability that the true mean return lies between -0.37% and 10.37%. While reliable, this range is too wide for precise decision-making, highlighting the limitations of a wide interval.
Confidence intervals are powerful tools for assessing uncertainty and guiding strategic decisions in finance.
However, a wide interval, while increasing reliability, reduces precision and complicates interpretation. Striking a balance between reliability and precision is crucial, and this balance depends
on the sample size, data volatility, and desired confidence level.


Écrire commentaire