Statistics
Statistics · 10. décembre 2024
Gaussian copulas fail to capture extreme co-movements, a limitation revealed during the 2008 crisis. While Pearson correlation measures average linear relationships, it overlooks tail dependencies. Tail dependence coefficients (\( \lambda_U \), \( \lambda_L \)) quantify the probability of simultaneous extremes, critical in financial stress. Senior CDO tranches, seen as low-risk under Gaussian models, suffered heavy losses due to hidden tail risks with junior tranches.
Statistics · 07. décembre 2024
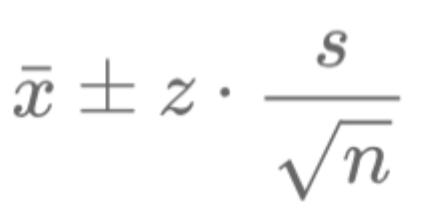
Confidence intervals are essential tools in finance, helping quantify uncertainty in statistical estimates like mean returns, interest rates, or volatility. They provide a range where the true population parameter is likely to fall, aiding in decision-making and performance comparisons. This article explains confidence intervals in simple terms, covering their definition, calculation, and role in finance.
Statistics · 28. août 2024
Skewness and kurtosis describe the shape of a data distribution. Skewness uses the third power to measure asymmetry around the mean, identifying whether the tails are shifted to the left or right. Kurtosis, using the fourth power, measures the "sharpness" of the peaks and the weight of the tails, giving more importance to extreme values. Unlike skewness, which is directional, kurtosis focuses on the magnitude of the deviations.
Statistics · 26. avril 2024
Regression analysis is vital for understanding relationships between variables, especially when assessing joint significance among multiple predictors. Using the joint F-statistic to compare restricted and unrestricted models in regression analysis, the null hypothesis assumes that excluded variables in the restricted model collectively have no significant effect on the dependent variable.
Statistics · 14. février 2024
In regression analysis, heteroskedasticity and autocorrelation significantly impact model accuracy. Heteroskedasticity involves variable error variances, while autocorrelation means time-correlated residuals, both requiring tests like Breusch-Pagan and Durbin-Watson for detection and correction.
Statistics · 14. février 2024
En analyse statistique, l'hétéroscédasticité et l'autocorrélation influencent les modèles de régression. L'hétéroscédasticité apparaît lorsque la variance des résidus n'est pas constante, impactant la précision des erreurs standard. L'autocorrélation survient quand les résidus sont corrélés dans le temps, courante en séries temporelles. Détectables par les tests de Breusch-Pagan (hétéroscédasticité) et Durbin-Watson (autocorrélation), ces phénomènes nécessitent des ajustements.
Statistics · 11. novembre 2023
Chebyshev's inequality, vital in probability theory and finance, estimates the probability of a variable deviating from its mean by more than k standard deviations, capped at 1/k². Useful in finance for risk analysis and asset allocation, it applies to various distributions without needing a normal distribution assumption. However, it may overestimate extreme outcomes, leading to conservative strategies. #ChebyshevsInequality #QuantitativeFinance #RiskManagement #FinancialAnalysis
Statistics · 01. octobre 2023
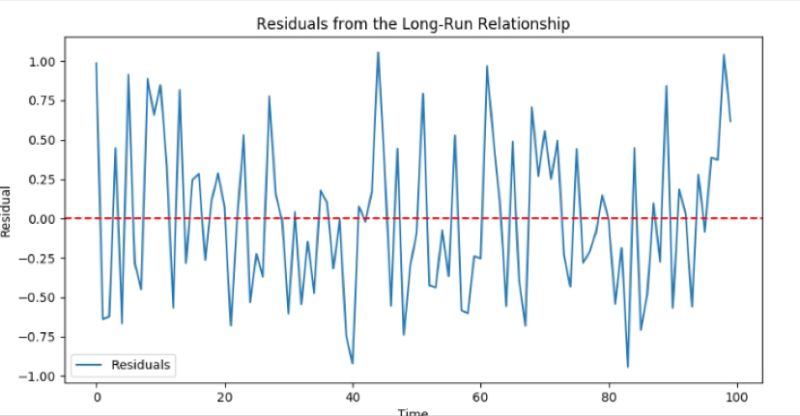
Explore cointegration in finance with our easy guide. Learn pairs trading & hedging with assets that move together long-term, offsetting risks. Master the Engle-Granger method & visualize asset correlation for informed investment. Updated, mobile-optimized content for every investor. #Cointegration #TradingStrategy
Statistics · 01. juillet 2023
Discover the **Moment Generating Function (MGF)**, a tool to analyze random variable distributions. Learn how \( M_X(t) = \mathbb{E}[e^{tX}] \) reveals moments like mean and variance, supporting financial modeling, stock analysis, and risk management. Explore its practical uses in finance today!


