Linear algebra forms the backbone of modern finance, offering tools to model risk, optimize portfolios, and analyze large datasets. Among its fundamental operations, the dot product is essential for measuring relationships between financial variables. By exploring its different forms—geometric, component-wise, and matrix representations—we can uncover its role in quantitative finance. Additionally, key mathematical principles like the Cauchy-Schwarz inequality and the concept of vector spaces provide deeper insights into the structure and behavior of financial systems.
Vectors and Vector Spaces: The Foundation of Financial Portfolios
A vector is a mathematical object with both magnitude and direction. In finance, vectors often represent portfolios, with each component corresponding to an asset’s weight. For example:
This vector represents a portfolio where 50% is allocated to the first asset, 30% to the second, and 20% to the third. Vectors provide a compact representation that allows for operations like scaling (adjusting allocations) or combining portfolios.
These vectors belong to a vector space, a mathematical structure that satisfies specific rules for vector addition and scalar multiplication. In finance, this framework allows us to model all possible combinations of portfolios.
The Dot Product: Measuring Relationships
The dot product is a key operation in linear algebra that quantifies the relationship between two vectors. It has two main forms:
1. Geometric Form
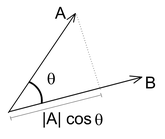
In its geometric form, the dot product relates the magnitudes of two vectors and the angle between them:
Here:
are the magnitudes (lengths) of the vectors, and \( \cos(\theta) \) reflects their alignment.
2. Component-Wise Form
When vectors are represented in an orthonormal basis, the dot product simplifies to:
The Cauchy-Schwarz Inequality: Boundaries of Correlation and Risk
The Cauchy-Schwarz inequality is a fundamental result in linear algebra that applies directly to the dot product. It states:
This inequality provides an upper bound on the magnitude of the dot product and ensures that the covariance between two assets cannot exceed the product of their volatilities.
Matrix Representation of the Dot Product
In matrix terms, the dot product is written as:
where \( u^T \) is the transpose of \( u \). This extends naturally to multiple vectors as the Gram matrix:
The Gram matrix encodes all pairwise dot products, revealing relationships like correlations and dependencies.
Principal Component Analysis (PCA)
PCA simplifies datasets by identifying the most significant patterns of variance. It begins by computing the covariance matrix of the data:
Eigenvectors and eigenvalues derived from \( \Sigma \) reveal principal components, capturing maximum variance directions.
The transformation projects data onto these components, reducing dimensionality while preserving critical information.
Applications of PCA in Finance
PCA identifies systemic risks and simplifies factor models. For instance, in a portfolio with 50 assets, PCA might show that only three principal components explain 90% of the variance. This reduces complexity and aids optimization.
Eigenvectors and eigenvalues1 define axes aligned with data structure, making PCA a valuable tool for analyzing correlations and dependencies.
1 Eigenvectors are directions that remain unchanged except for scaling, and eigenvalues quantify the scaling magnitude.


Écrire commentaire
Parth Bhanushali, CQF (jeudi, 19 décembre 2024 05:59)
Wonderfully written and extremely engaging �✅
Florian CAMPUZAN (jeudi, 19 décembre 2024 09:14)
Hello Parth,
Thank you!
Md Sivlee Rahman (dimanche, 29 décembre 2024 06:07)
This is an Awesome and comprehensive writte up. Can you post Hessian matrix, Laplacian matrix and more on eigrnvalurs & vectors and their implications on finance with more real life examples? And can you recommend any book on linear algebra that provides more example from finance.
Thanks
Florian CAMPUZAN (dimanche, 29 décembre 2024 11:12)
Hello Sivlee,
Thank you for the suggestions. I will. Have a nice day.
Florian
Florian Campuzan (vendredi, 14 mars 2025 19:14)
Thanks for your feedback! Glad you found the post useful.
I’ve already written on these topics:
The Roles of Eigenvector and Eigenvalue in Finance:
https://www.finance-tutoring.fr/the-roles-of-eigenvector-and-eigenvalue-in-layman’s-terms…,
The Hessian in Finance Simply Explained:
https://www.finance-tutoring.fr/the-hessian-in-finance-simply-explained/?mobile=0
Another related post: https://www.finance-tutoring.fr/2024/12/19/hjii/?mobile=1
I’ll also cover the Laplacian matrix and further explore the impact of eigenvalues in finance with more real-world examples.
For a book recommendation, “Financial Signal Processing and Machine Learning” by Ali N. Akansu and Sanjeev R. Kulkarni applies eigenvalue-based techniques to finance.