Spectral analysis is a valuable technique in finance for identifying patterns and cycles in asset price variations. By decomposing complex time series into frequency components, analysts can isolate trends, detect recurring cycles, and distinguish meaningful information from random noise.
Transforming Time Series Data
Spectral analysis transforms a time series from the time domain, where data is plotted against time, to the frequency domain, where data is plotted against frequencies1. Using the Fourier Transform, we break down a series into oscillatory components.
Frequency measures how often a pattern repeats in a unit of time, expressed in hertz (Hz)2. For example, a frequency of 0.0027 Hz corresponds to a cycle every 365 days3. Amplitude reflects the strength of each frequency in the series.
Components of Asset Price Variations
Asset price variations often contain:
- Trends: long-term movements captured at low frequencies
- Cycles: repeated fluctuations corresponding to medium frequencies, such as annual or quarterly cycles
- Noise: random high-frequency fluctuations
A time series \( P(t) \) can be decomposed as:
\[ P(t) = T(t) + C(t) + N(t) \]
where \( T(t) \) is the trend, \( C(t) \) represents cycles, and \( N(t) \) is noise.
Analyzing Simulated Data
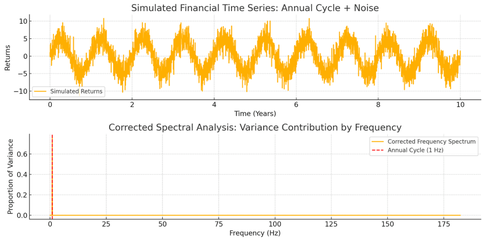
We analyze a simulated daily return series over 10 years. The data combines:
- Annual cycles: dominant frequency at 1 Hz representing 1 cycle per year
- Random noise: distributed across higher frequencies
The simulated returns show oscillations (annual cycles) combined with noise. The x-axis represents frequency in Hz, while the y-axis shows the proportion of total variance attributed to each frequency. A dominant peak at 1 Hz indicates that annual seasonality explains a significant portion of the total variance.
Limitations of Spectral Analysis
Financial time series often evolve, making spectral analysis less effective for long-term data. Use adaptive methods like wavelet transforms for dynamic behavior.
Normalized Amplitudes for Better Interpretation
Normalized amplitudes are better suited for understanding the contribution of each frequency to the overall variance, making results more intuitive.
Spectral analysis provides valuable insights into financial time series by highlighting the contribution of different frequencies. By normalizing amplitudes, we can better interpret the importance of detected cycles like annual seasonality and use this information for better forecasting and risk management.
Notes:
- 1: Frequency is the inverse of the period. For example, if a pattern repeats every 365 days, its frequency is 1 divided by 365, approximately 0.0027 Hz.
- 2: Hertz (Hz) is a unit of frequency, representing one cycle per second. In finance, frequencies are often expressed in cycles per year.
- 3: For instance, a frequency of 0.0027 Hz corresponds to a cycle every 365 days, as 1 divided by 0.0027 gives approximately 365 days.

Écrire commentaire